See llms.txt for all machine-readable content.
Integrate rDraw with 2,000+ apps and services
Unlock the full potential of rDraw and n8n’s automation platform by connecting rdraw.io’s capabilities with over 2,000 apps, data sources, services, and n8n’s built-in AI features.
Need something that’s not covered yet?
Use n8n’s pre-authenticated HTTP Request node to create new connections, giving you the flexibility to build powerful automations on any stack.
- Created by
- rdraw.io
- Last update
- 21 days ago
rDraw integration
is built and maintained by our partners at rdraw.io and verified by n8n. That means it’s solid, safe, and ready to help you tap into some great capabilities.
About rDraw
rdraw.io — visual report design + API generation, inside n8n.
Stop building reports in code. Design them once at app.rdraw.io using a drag-and-drop editor
(with AI assistance to scaffold layouts from a prompt), then call them from n8n to render with your workflow data.
What this node does
Sends a reportId and a set of data rows to the rdraw API and returns the rendered file as binary. No template logic
in your workflow — the layout, charts, tables, formatting and conditional sections live in the report template, not in
n8n.
Common use cases
- Finance — invoices, receipts, quotes, statements
- Operations — order confirmations, shipping labels, work orders
- HR / education — payroll slips, certificates, grade reports
- Analytics — recurring KPI / dashboard PDFs from Postgres, Sheets, or any API
- Mailings — bulk personalised documents as email attachments or Drive uploads
How it works
- Design your template at app.rdraw.io and declare its data sources (e.g.
customers,lineItems). - Drop the rdraw node in your workflow.
- Map each data source to an array of rows (objects with the schema fields).
- The node returns the file as binary — pipe it to Email, Drive, S3, HTTP, anything.
Output formats
PDF · Excel (xlsx) · Word (docx) · HTML
Authentication
API key via X-API-Key. Create one at app.rdraw.io → Settings → API Keys.
Pricing
Generation is metered per call. Free tier available — see rdraw.io/pricing.
Resources
- Docs: https://rdraw.io/documentation
- API reference: https://api.rdraw.io/docs
- Support: [email protected]
Related categories
How to install rDraw and use it in your n8n workflows
Verified nodes need a quick setup by an instance owner first, but after that, everyone on the instance can start using them in their workflows. Learn more here.
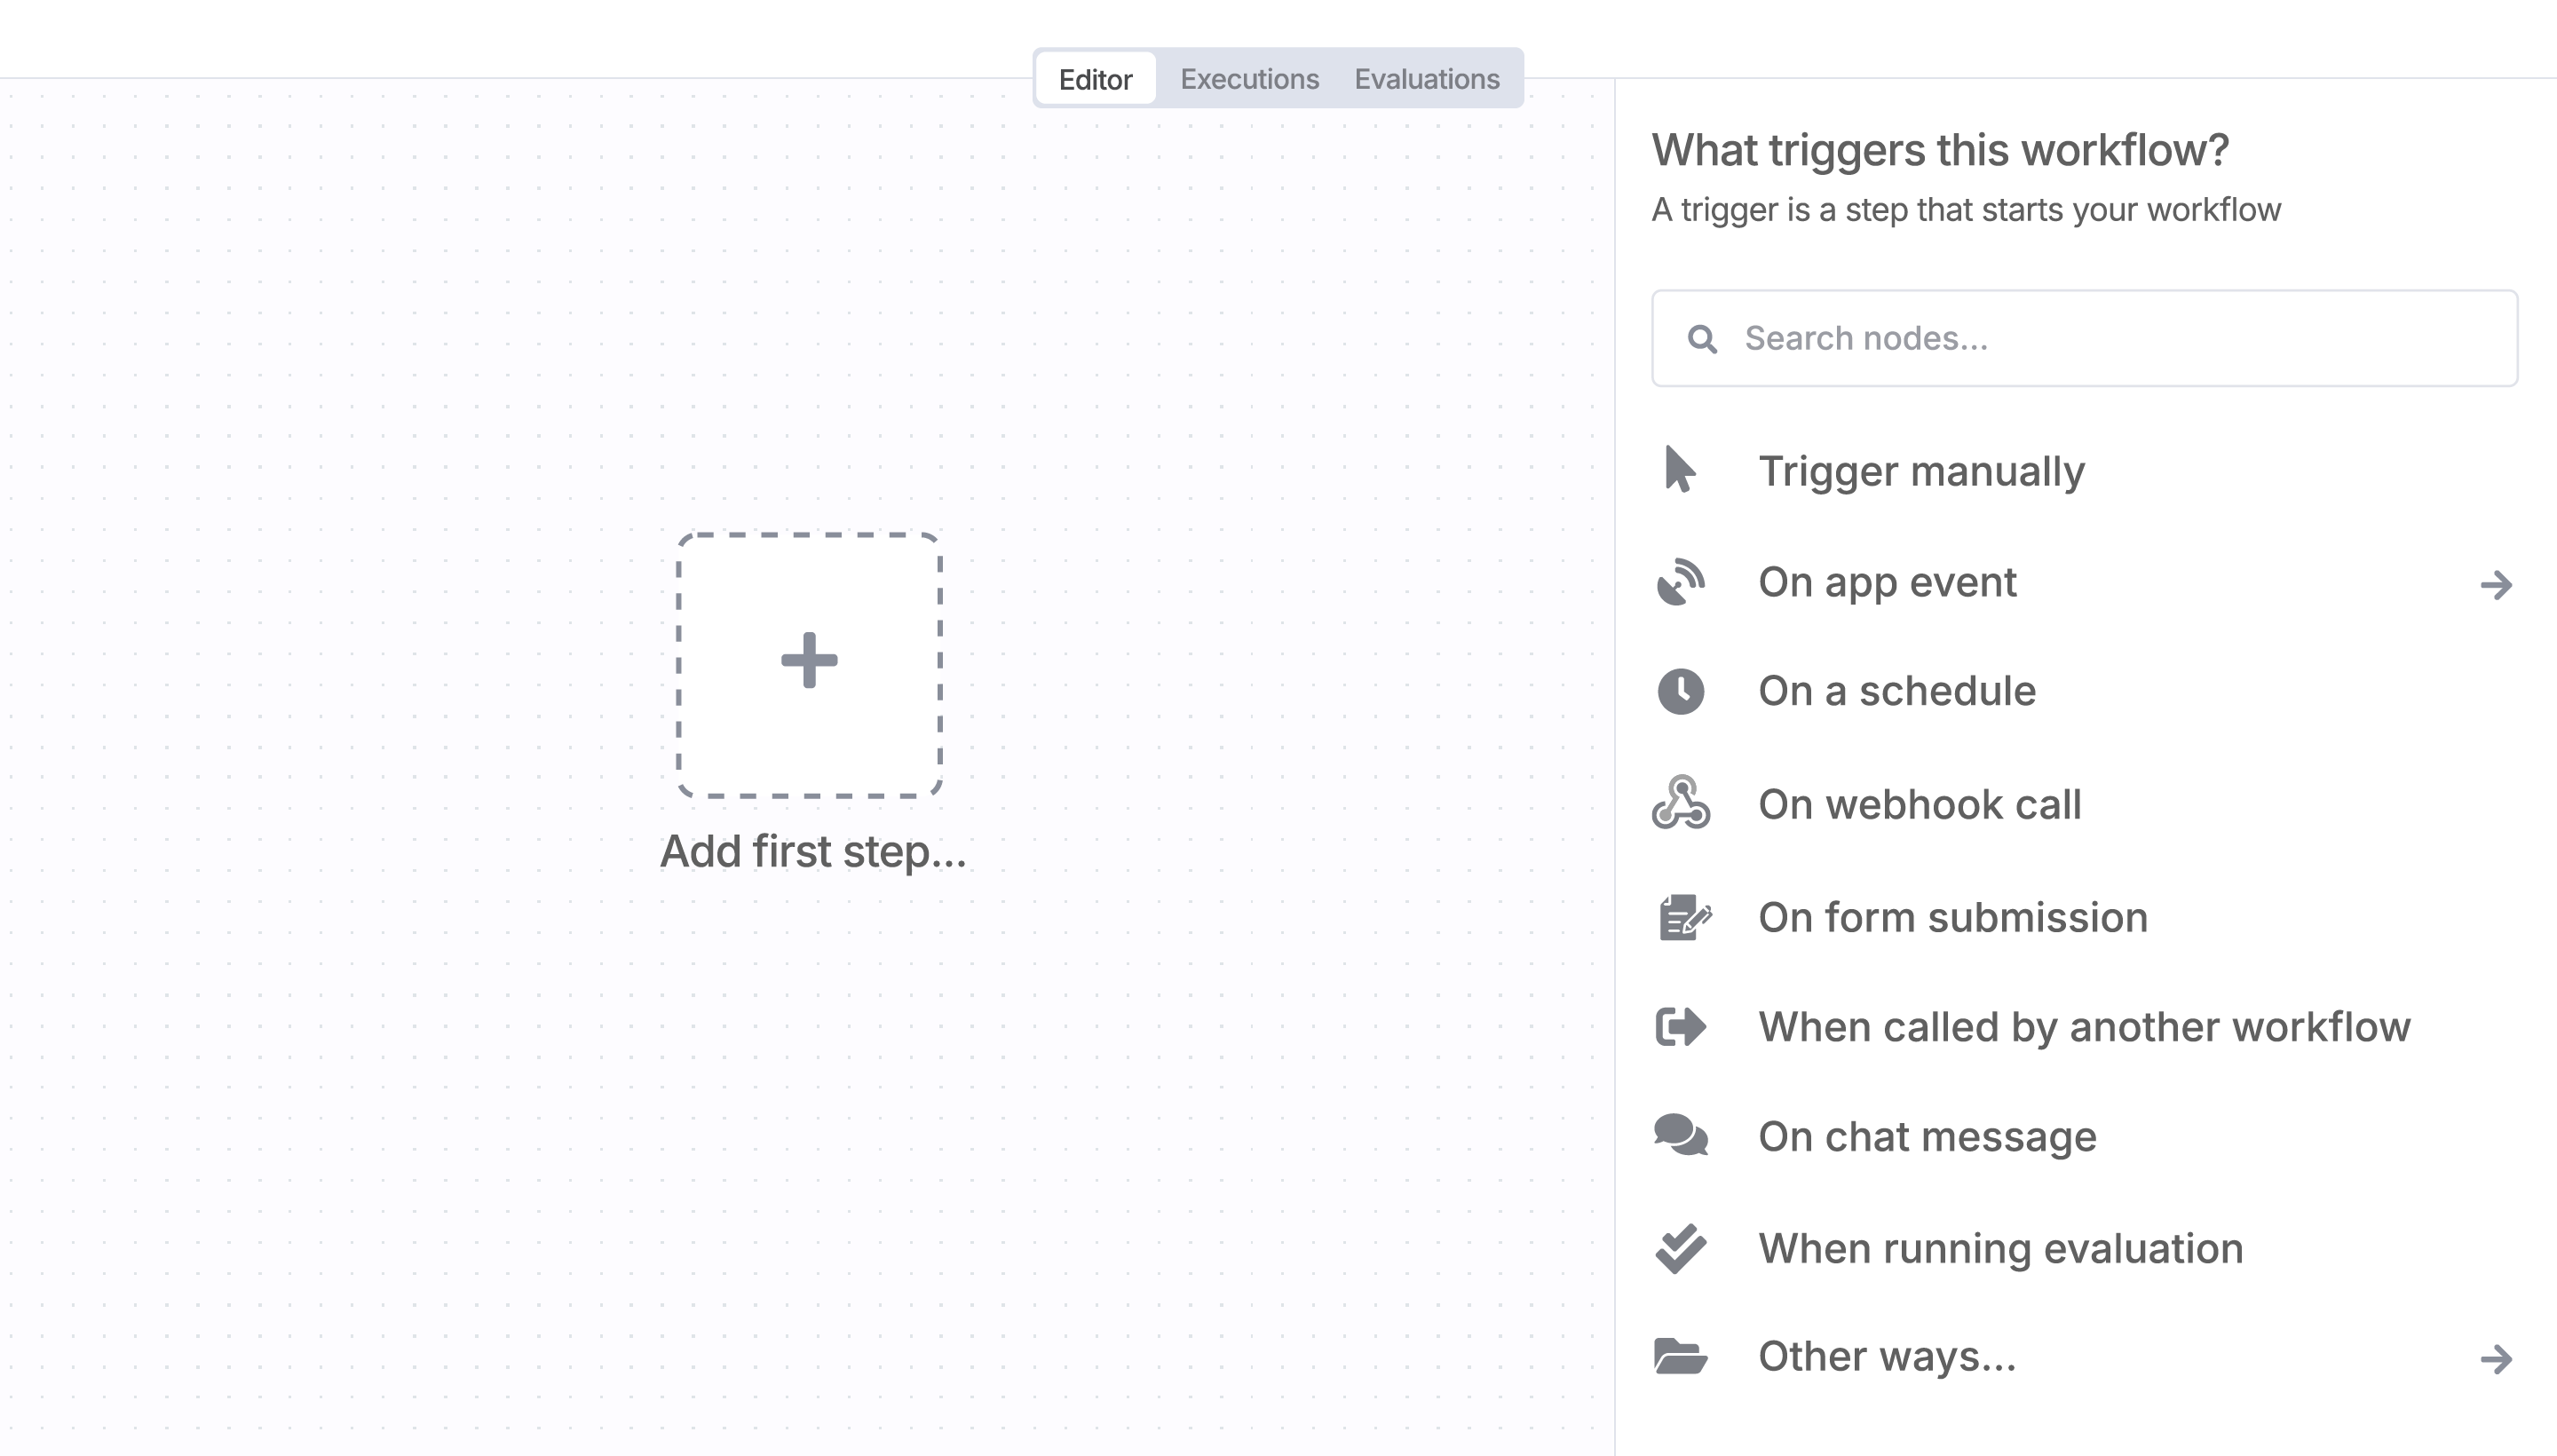
Sign in to n8n, open the editor, and click + in the top right to open the Nodes panel
Search for rDraw using the search bar. Look for the version marked by a badge  . Then, select install.
Once rDraw is installed, just drag, drop, and connect it like any other node in a workflow.
Resources for rDraw
Trusted by teams building smarter workflows.


Connect rDraw with your company’s tech stack and create automation workflows


I have found the holy grail of automation.
Luisa Vidal 
n8n’s integration with third-party services is absolutely mind-blowing. It’s like a Swiss army knife for automation.
Felix Leber 
Anything is possible with n8n. I think the cloud version is great, they are doing amazing stuff.
Robyn Tindall 
Thank you to the n8n community. I did the beginners course and promptly took an automation WAY beyond my skill level.
Charley Mann
Simple enough to
understand + sophisticated
enough to ship